Proven Results in Student Math Achievement
Next Gen Math consistently demonstrates its ability to drive significant improvements in student math performance across schools. We track concrete data from state test results to measure math gains and validate the efficacy of our data-driven, educator-built solution.
★ ★ ★ ★ ★
SBAC Data Highlights
Below, you’ll find SBAC data showcasing year-over-year gains in math performance for a wide range of schools and districts using Next Gen Math. These results underscore the tangible impact our platform has on student achievement when implemented effectively.
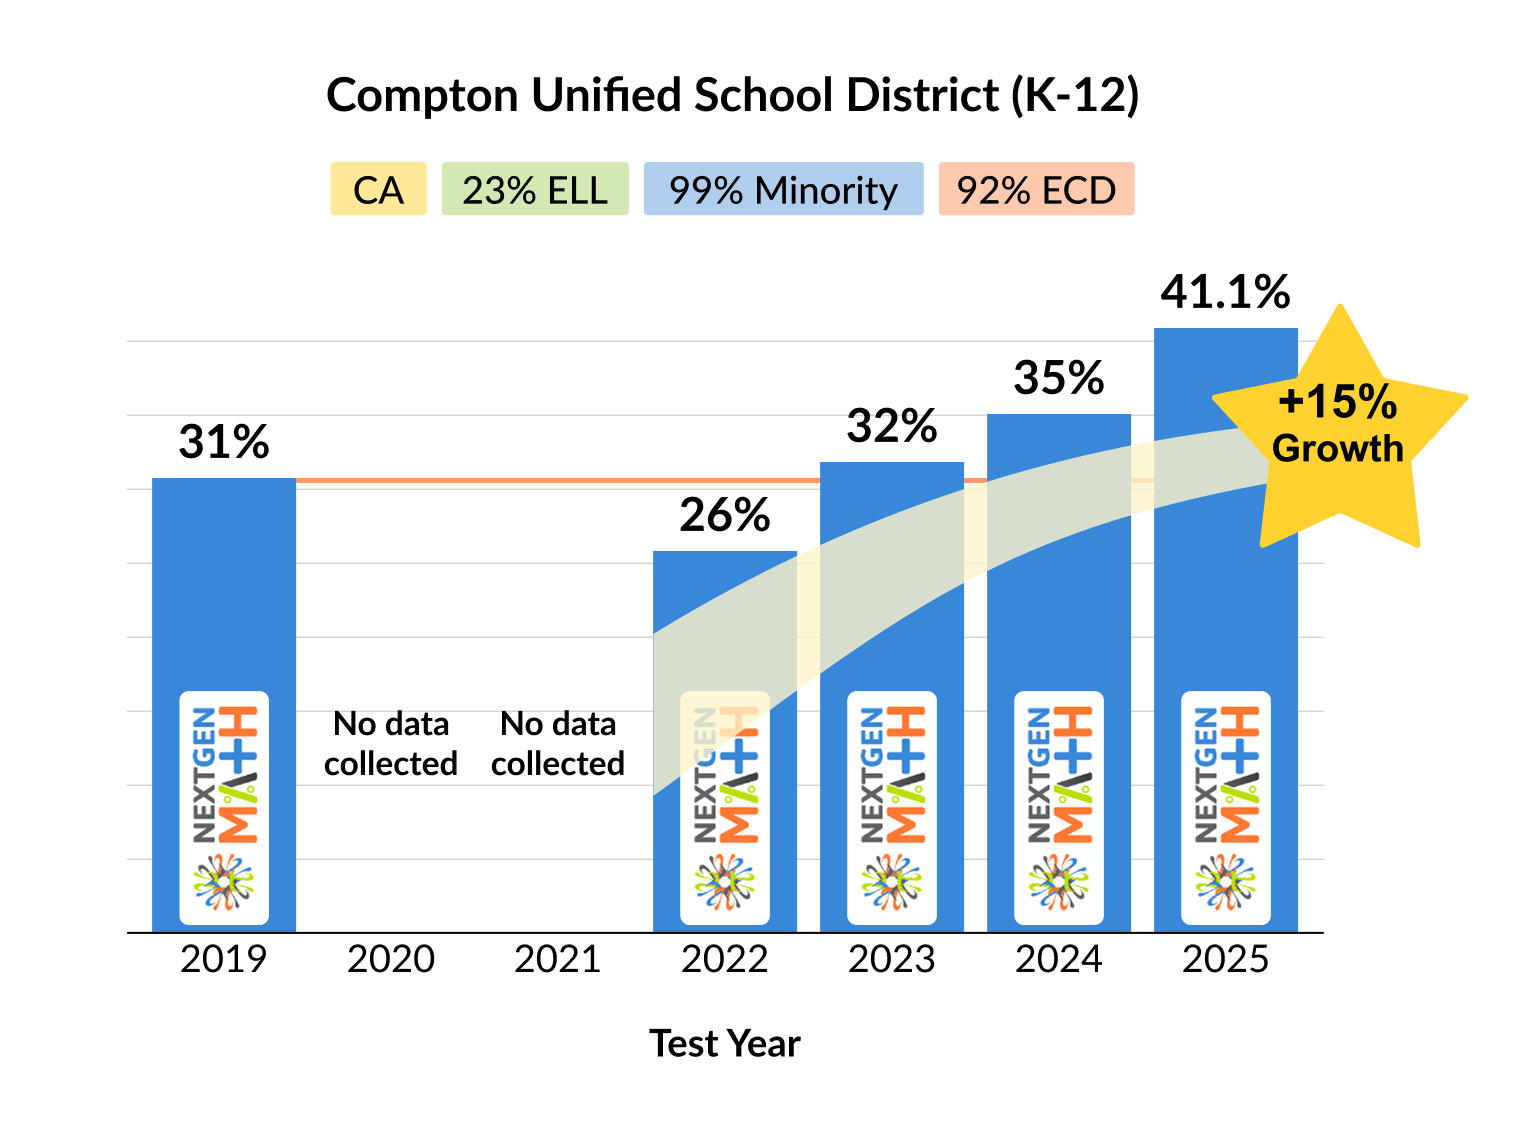
Compton USD adopted NextGenMath.com in 2019 for Grades K-8 and for 9-12 in 2025. The district uses it extensively for assignments, practice, assessments, instruction and intervention. Annual CAASPP math results show consistent growth year on year.
Click here to hear from Compton USD leaders, educators and students.
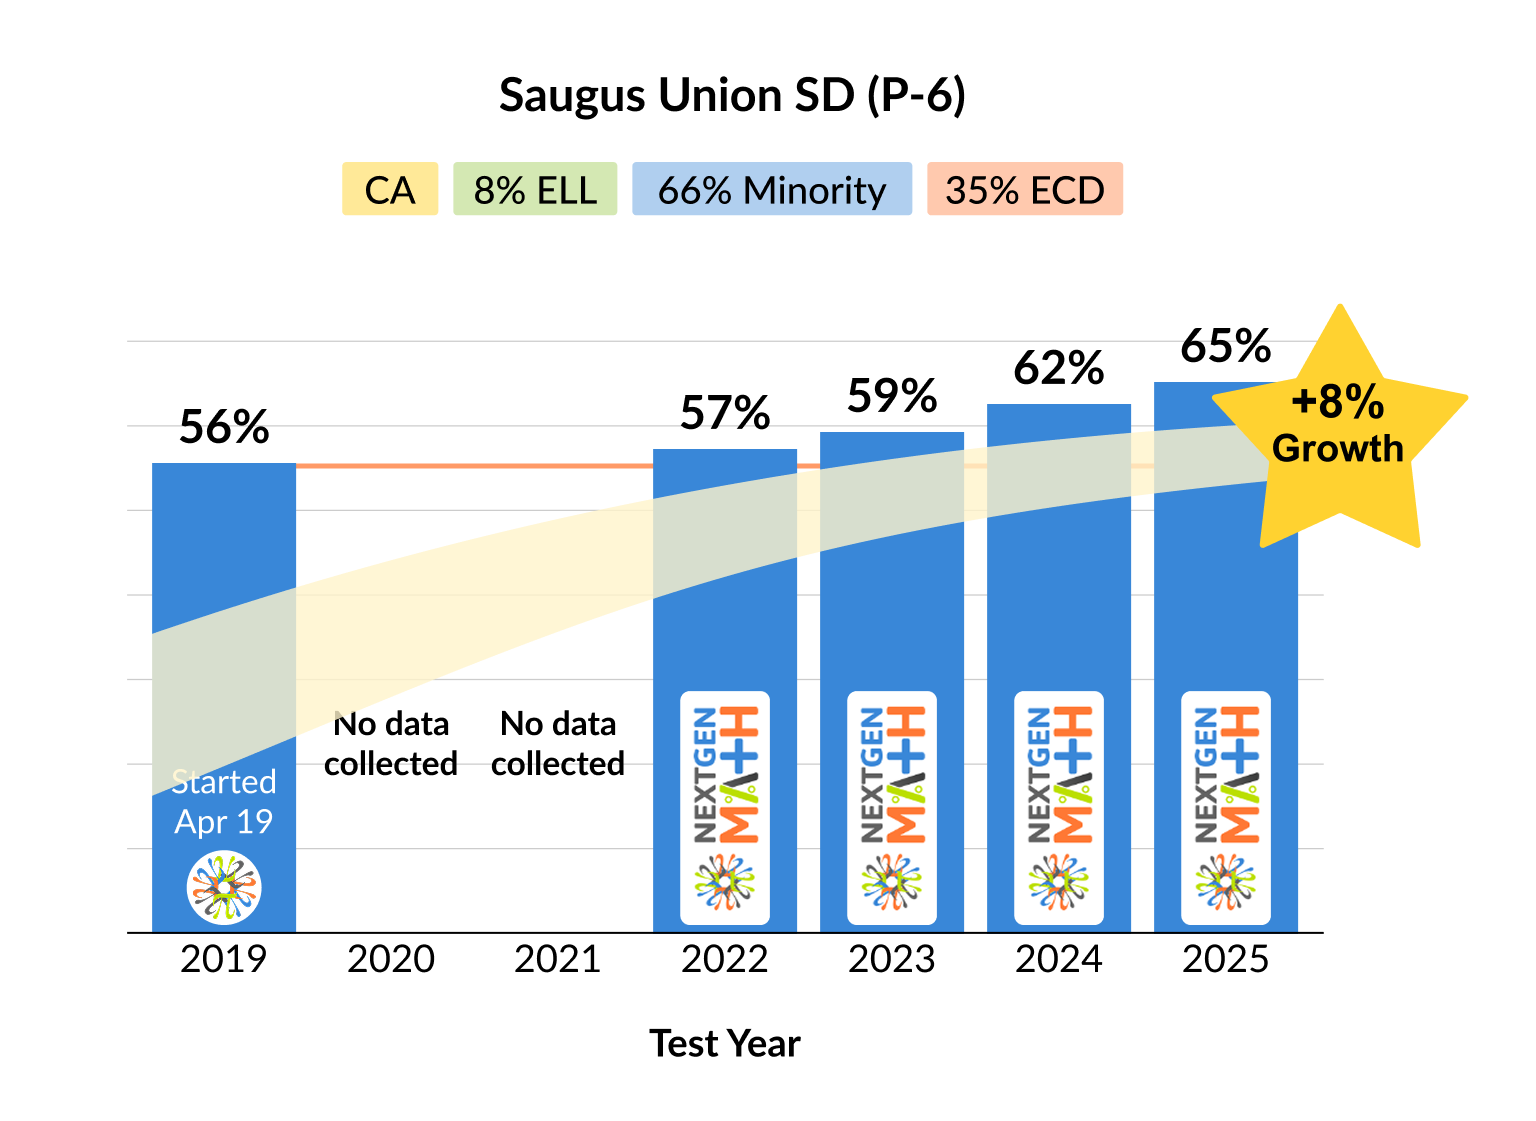
Saugus Union School District adopted NextGenMath.com in 2019 for grades K-6, and uses it extensively for assignments, practice, assessments, instruction and intervention. Annual CAASPP math results show consistent growth year on year.
★ ★ ★ ★ ★
School Success
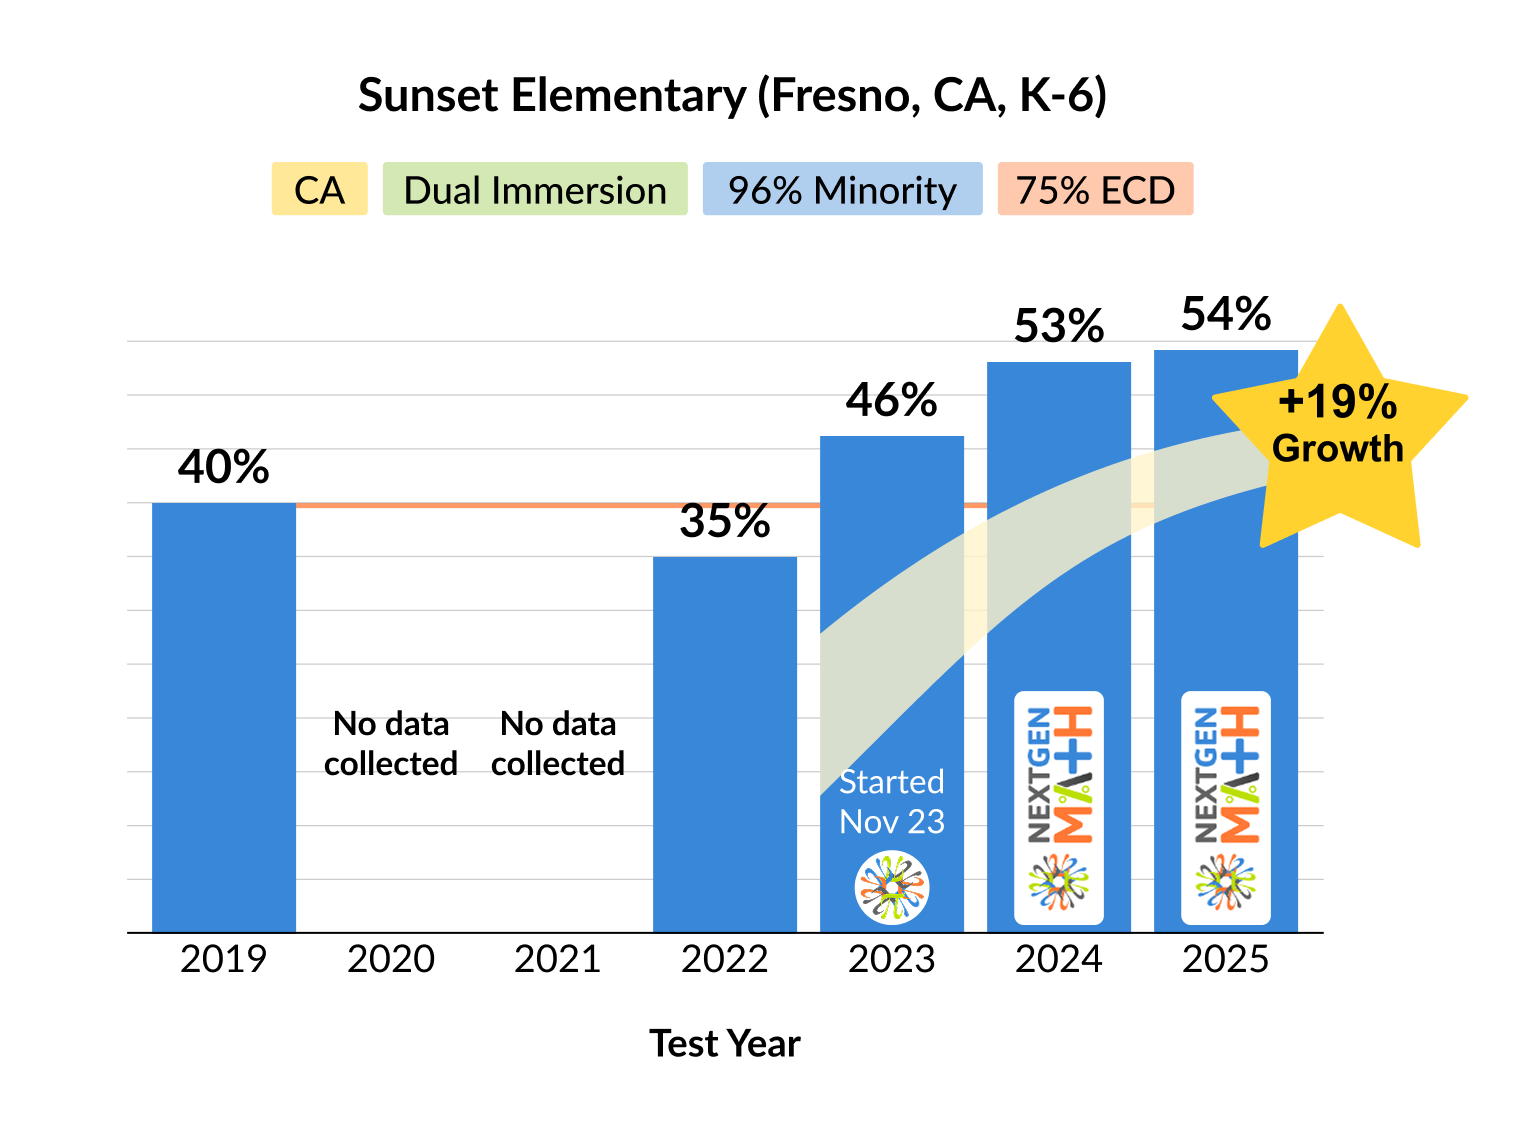
Sunset Elementary School adopted NextGenMath.com in March 2023 for grades K-6, and uses it extensively for assignments, practice, assessments, instruction and intervention. CAASPP math results shows significant growth even after a partial year.
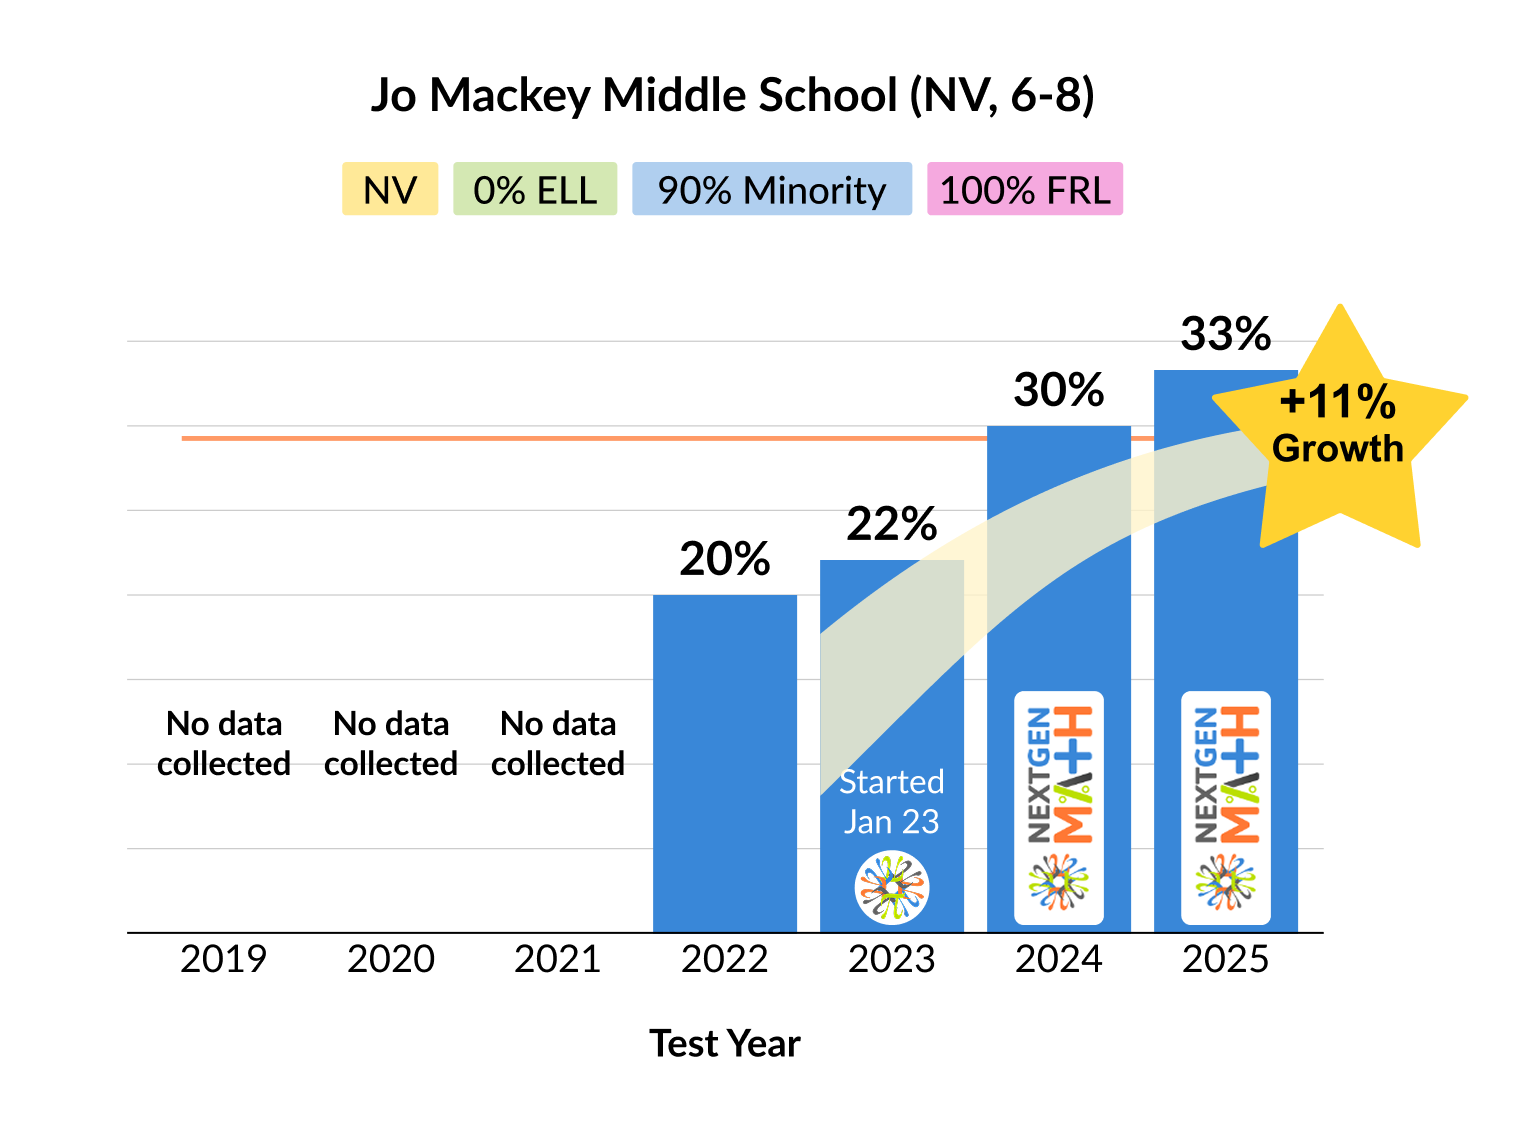
Jo Mackey Magnet School adopted NextGenMath.com in 2023 for grades 6-8, and uses it extensively for assignments, practice, assessments, instruction and intervention. Nevada SBAC math results show consistent growth year on year.
★ ★ ★ ★ ★
Elevate Student Performance, No Matter Your Starting Point
Next Gen Math provides the data-driven supplemental math platform teachers need to elevate student performance and close achievement gaps, proven to work in all kinds of school environments.
Proven Across Diverse Environments
- ✔ Small schools to large districts
- ✔ Charter and public
- ✔ Ethnically-diverse, ELL, IEPs, etc.
- ✔ All socio-economic backgrounds
Delivers on Key Academic Goals
- ✔ Reverse stagnant or declining math results
- ✔ Accelerate growth in high-performing environments
- ✔ Bring struggling students to grade-level
Interested in bridging learning gaps and accelerating math growth immediately?
2023-24 Math Growth Highlights
Explore results from more Next Gen Math partner schools and districts below. Charts show the percent of students who met or exceeded state standards in math, year over year.
Compton USD adopted NextGenMath.com in .
The absence of a bar indicates that no test data was collected that year.
Serrano Middle School adopted NextGenMath.com in .
The absence of a bar indicates that no test data was collected that year.
Lincoln Elementary School adopted NextGenMath.com in .
The absence of a bar indicates that no test data was collected that year.
Edgewood Academy adopted NextGenMath.com in .
The absence of a bar indicates that no test data was collected that year.
Pixley Middle School adopted NextGenMath.com in .
The absence of a bar indicates that no test data was collected that year.
Saugus USD adopted NextGenMath.com in .
The absence of a bar indicates that no test data was collected that year.
Cold Spring ESD adopted NextGenMath.com in .
The absence of a bar indicates that no test data was collected that year.
Hope ESD adopted NextGenMath.com in .
The absence of a bar indicates that no test data was collected that year.
Goynes Elementary School adopted NextGenMath.com in .
The absence of a bar indicates that no test data was collected that year.
Lee Antenello Elementary School adopted NextGenMath.com in .
The absence of a bar indicates that no test data was collected that year.
Jo Mackey Middle School adopted NextGenMath.com in .
The absence of a bar indicates that no test data was collected that year.
Outside Creek ESD adopted NextGenMath.com in .
The absence of a bar indicates that no test data was collected that year.
Pixley USD adopted NextGenMath.com in .
The absence of a bar indicates that no test data was collected that year.
Laurel Street Elementary School adopted NextGenMath.com in .
The absence of a bar indicates that no test data was collected that year.
Davis Middle School adopted NextGenMath.com in .
The absence of a bar indicates that no test data was collected that year.
Burroughs Elementary School adopted NextGenMath.com in .
The absence of a bar indicates that no test data was collected that year.
Scandinavian Middle School (Pilot) adopted NextGenMath.com in .
The absence of a bar indicates that no test data was collected that year.
Sunset Elementary School adopted NextGenMath.com in .
The absence of a bar indicates that no test data was collected that year.
Elizabeth Terronez Middle School adopted NextGenMath.com in .
The absence of a bar indicates that no test data was collected that year.
Tehipite Middle School adopted NextGenMath.com in .
The absence of a bar indicates that no test data was collected that year.
Heber School adopted NextGenMath.com in .
The absence of a bar indicates that no test data was collected that year.
Bonita Street Elementary School adopted NextGenMath.com in .
The absence of a bar indicates that no test data was collected that year.
Alliance College-Ready Middle Academy 8 adopted NextGenMath.com in .
The absence of a bar indicates that no test data was collected that year.
Alliance College-Ready Middle Academy 4 adopted NextGenMath.com in .
The absence of a bar indicates that no test data was collected that year.
Magnolia Science Academy Santa Ana adopted NextGenMath.com in .
The absence of a bar indicates that no test data was collected that year.
KIPP Adelante Preparatory Academy adopted NextGenMath.com in .
The absence of a bar indicates that no test data was collected that year.
Howard Tanner Elementary adopted NextGenMath.com in .
The absence of a bar indicates that no test data was collected that year.
Montera Elementary adopted NextGenMath.com in .
The absence of a bar indicates that no test data was collected that year.
Cutler Elementary adopted NextGenMath.com in .
The absence of a bar indicates that no test data was collected that year.
Whaley Middle adopted NextGenMath.com in .
The absence of a bar indicates that no test data was collected that year.
Tesoro del Valle Elementary adopted NextGenMath.com in .
The absence of a bar indicates that no test data was collected that year.
Harney Middle School adopted NextGenMath.com in .
The absence of a bar indicates that no test data was collected that year.
Highgate Elementary adopted NextGenMath.com in .
The absence of a bar indicates that no test data was collected that year.
Marcum-Illinois Union Elementary adopted NextGenMath.com in .
The absence of a bar indicates that no test data was collected that year.